Success Story
About the Client

Nokia is a global leader in information and communications technology, specializing in network operations across devices, industries, and regions. Through its extensive portfolio, Nokia delivers cutting-edge solutions in telecom systems, 5G, private and enterprise networks, IoT, cloud infrastructure, optical transport, IP routing, and cybersecurity, addressing a wide range of organizational connectivity and infrastructure needs.
Business Situation
Nokia partnered with a leading telecom provider in India to expand its router infrastructure across Tier 3 and Tier 4 cities, driving significant growth in service adoption. As their market presence grew, Nokia recognized an opportunity with the vast operational data being generated by thousands of active routers. They envisioned an advanced analytics and automated management platform for this data to continuously enhance their device performance and network reliability in the country.
However, their manual data interpretation processes resulted in delays and operational errors, hindering timely decision-making. So, to fulfill their vision of becoming a performance-driven market leader, Nokia sought a partner who could manage their data surplus and build a data analytics solution that quickly converts raw router data into actionable business intelligence.
Unthinkable Solutions fulfilled this vision by delivering an end-to-end, scalable data visualization platform. The tech team designed mobile and web applications capable of organizing massive datasets into over 42 dynamic dashboards, automating reporting, enabling centralized control, and supporting auto-scaling for growing data volumes.
Key Requirements
Nokia partnered with Unthinkable Solutions to design and implement an automated data interpretation and analytics solution. The collaboration focused on converting vast and extensive data streams into interactive mobile and web-based dashboards to support performance tracking, user management, and ensure continuous improvement.
Some of the key technology requirements were:
A robust, scalable analytics backend to process and visualize vast router data in real time across mobile and web dashboards
Centralized user management system to efficiently control access, monitor activity, and update performance metrics as needed
Advanced dashboard suite featuring dynamic visualizations, multi-layered filtering, and customizable views, empowering users to interpret data from multiple operational angles
Enable precise error tracking mechanisms paired with comprehensive reports covering all key performance indicators and user-related metrics
Continuous improvement on the basis of real-time KPIs and user-centric analytics
Turning manual analytics into insights-driven data analytics dashboards
The project started with an analysis of Nokia’s existing data architecture. The Unthinkable Solutions tech team studied how data was collected, what formats were used, and how different teams accessed it. They worked closely with Nokia’s network engineers and analysts to understand tangible business outcomes they wanted. Those included real-time visibility, performance tracking, and error detection.
During the planning phase, the team defined key performance indicators and mapped out user roles. They chose a tech stack that was able to support auto-scaling and faster deployment during heavy data loads.
The backend system was designed to quickly handle large volumes of data coming from network routers, without slowing down or crashing. This was done using Python for backend processing. From the client’s side, Unthinkable was provided with raw data downloads as flat files. This data was, then, cleaned, structured into schemas, and processed in real time. This allowed the system to generate insights instantly and feed them into dashboards without delay.
The frontend of mobile was designed with React Native to promote usability. Web dashboards were built using ReactJS with dynamic charts, filters, and multi-view options integrated on each platform. Ensuring that dashboards worked smoothly on both desktop and mobile, with layouts and features tailored for each screen size.
Next, error tracking was integrated into the system to detect errors and generate reports with relevant KPIs.
For ongoing improvement, user feedback mechanisms were implemented to collect suggestions directly through the dashboards. Key performance indicators were revised regularly to reflect changing business priorities.
Importantly, the main features of these platforms included a range of user-friendly data visualizations based on router performance and customer metrics to support informed decision-making.
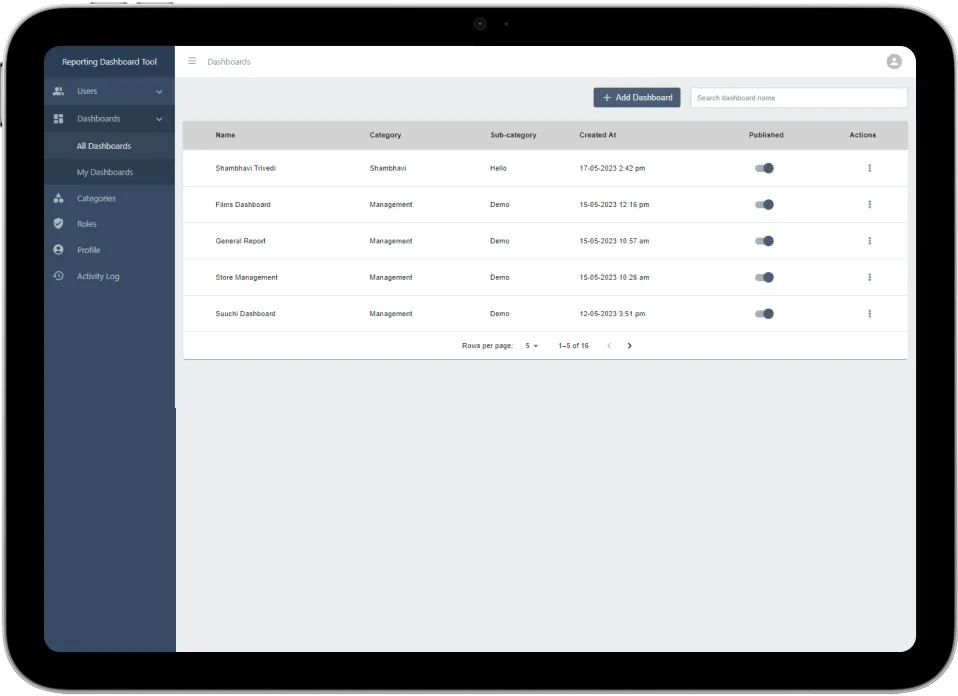
User Management System
A centralized user management system was added to control access and monitor activity. Role-based permissions ensured that only the right people could view or edit sensitive data. Here, users could monitor network performance in real time, check detailed error logs, and view metrics across different devices and locations.
Accurate Data Visualisation
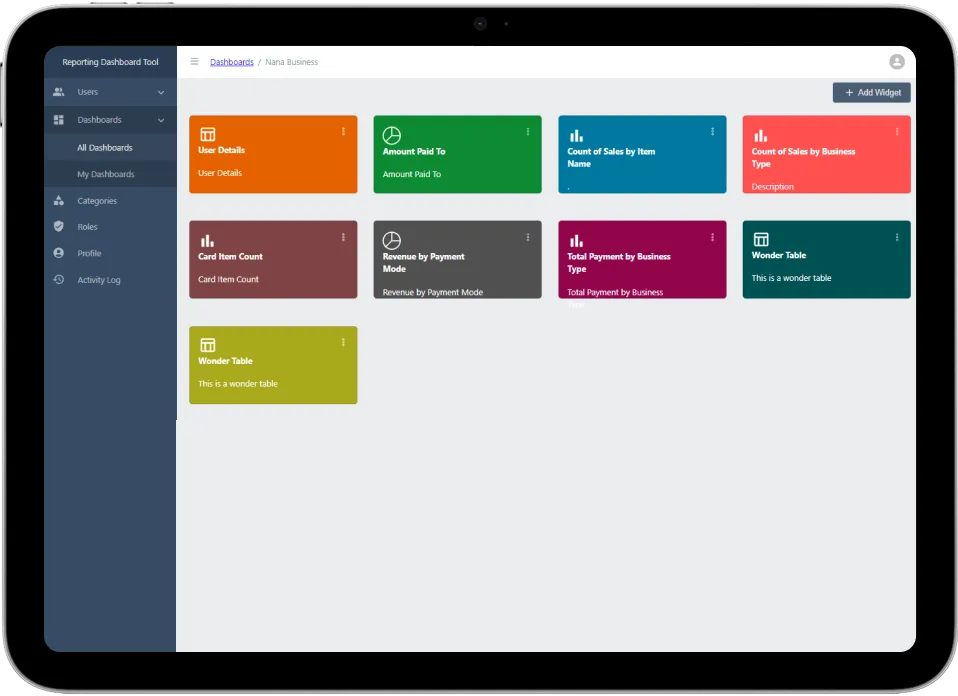
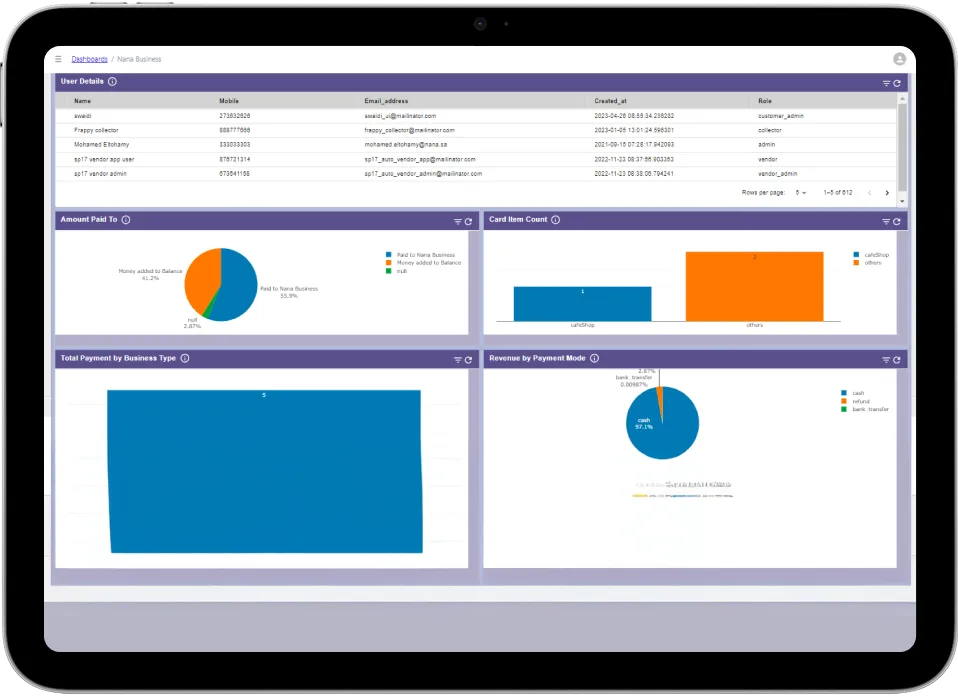
The application’s data interpretation and analytics features empower users to know deep, actionable insights through 42 meticulously designed dashboards, each tailored to present network performance and usage metrics in an intuitive way:
- Microwave Utilization, which tracks signals within the correct frequency bands to assess network performance.
- Utilization Trends provide users with detailed visibility into CPU utilization, an important metric for assessing the router’s operational health and performance efficiency.
- DWDM Topology measures the total traffic carried over specific light wavelengths within a single fiber optic cable, allowing efficient use of bandwidth.
- Circle-wise Fault Report, which breaks down router uptime and downtime data into clear, region-specific tables for effective fault detection and monitoring.
- The Cyclic Redundancy Check Report shows how often errors or corruptions happen in data during storage or transmission.
By combining these critical metrics, clients gain accurate insights into their business operations and performance enabling faster decision-making.
Self-scaling Infrastructure
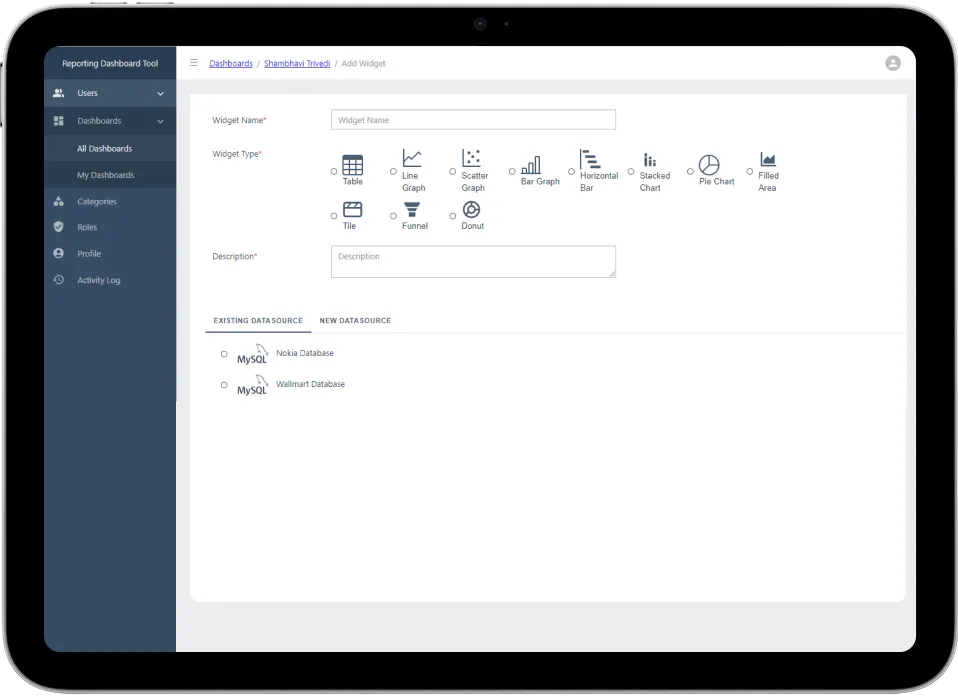
The application is designed to automatically increase or decrease its computing power based on how much data needs to be processed without any manual effort or system downtime. On top of that, both the web and mobile apps let users easily filter data using options like customer region (Circle/State), router brand, service impact, and router technology. This makes it much easier to organize and analyze the information.
Centralized & Secure Admin Control
Allows administrators full control over user management allowing them to manage user profiles and monitor user activity across applications. It also streamlines backend operations by enabling admins to map routers to specific regions and make adjustments to region-based analytics, ensuring data stays organized and actionable.
Precise Error Reporting & Performance Tracking
The system ensures smooth data uploads by automatically detecting any issues like corrupted files or failed data transfers during uploads via secure SFTP. These errors are captured in real time and used to improve data processing without any delays.
It measures critical operational metrics including instant uptime and downtime percentages with device-level identifiers namely, MAC addresses and serial numbers.
Further, a detailed report on support ticket data is covered including ticket volumes, issue categories, resolution status, and escalation paths.
Additionally, it tracks resolution efficiency through KPIs such as Mean Time to Repair (MTTR), First-Time Fix Rate (FTFR), and ticket aging trends.
The impact
In collaboration with Unthinkable Solutions, Nokia strategically positioned itself in the Indian telecom sector by introducing a modular data analytics framework that delivered measurable results.
With deployment of 42 comprehensive dashboards, Nokia was able to visualize KPIs and behavioral trends for multiple fields, enabling agile, data-driven decision-making across teams. Through this automated analytics platform, the company achieved a 57% reduction in manual effort and a 63% cut in data processing time, directly improving business agility and operational efficiency.
This seamless integration with Nokia’s data ecosystem and the ability to quickly deploy iterations enabled proactive monitoring and allowed teams to respond rapidly to newer market demands.
Overall, this initiative not only delivered technical excellence to Nokia but also drove substantial value through data-driven transformation.

42
Dashboards for detailed data analysis
57%
Cut in manual efforts via automation
63%
Faster data processing